- Indicators
Featured Products
- Volume Profile Analysis
- Documentation
- Pricing
- Sign in
Volume Profile Analysis
Volume Profile Analysis is a technique used in financial markets, particularly in trading, to analyze the distribution of trading volume at various price levels over a specific period. It provides insights into where trading activity has occurred and helps traders understand the levels of support and resistance within a given market.

Volume at Price Levels
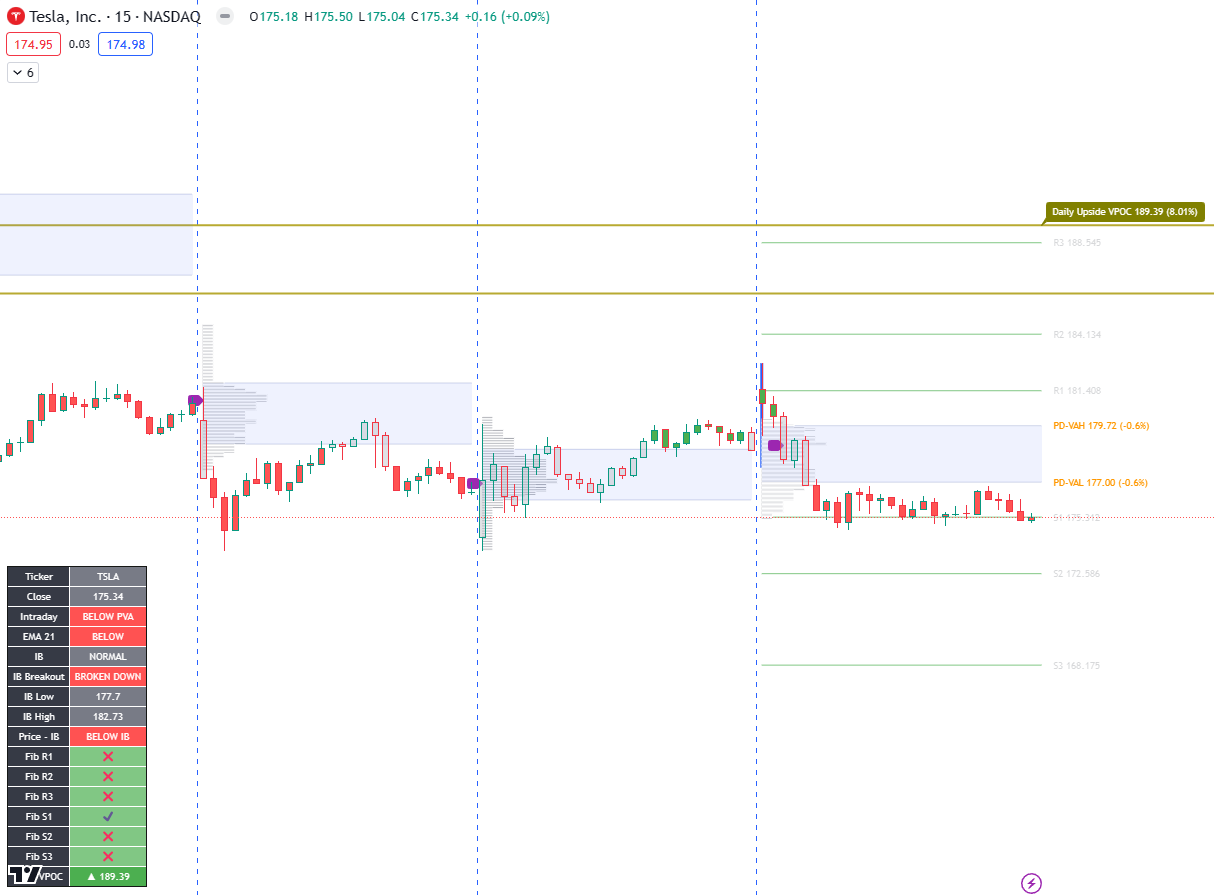
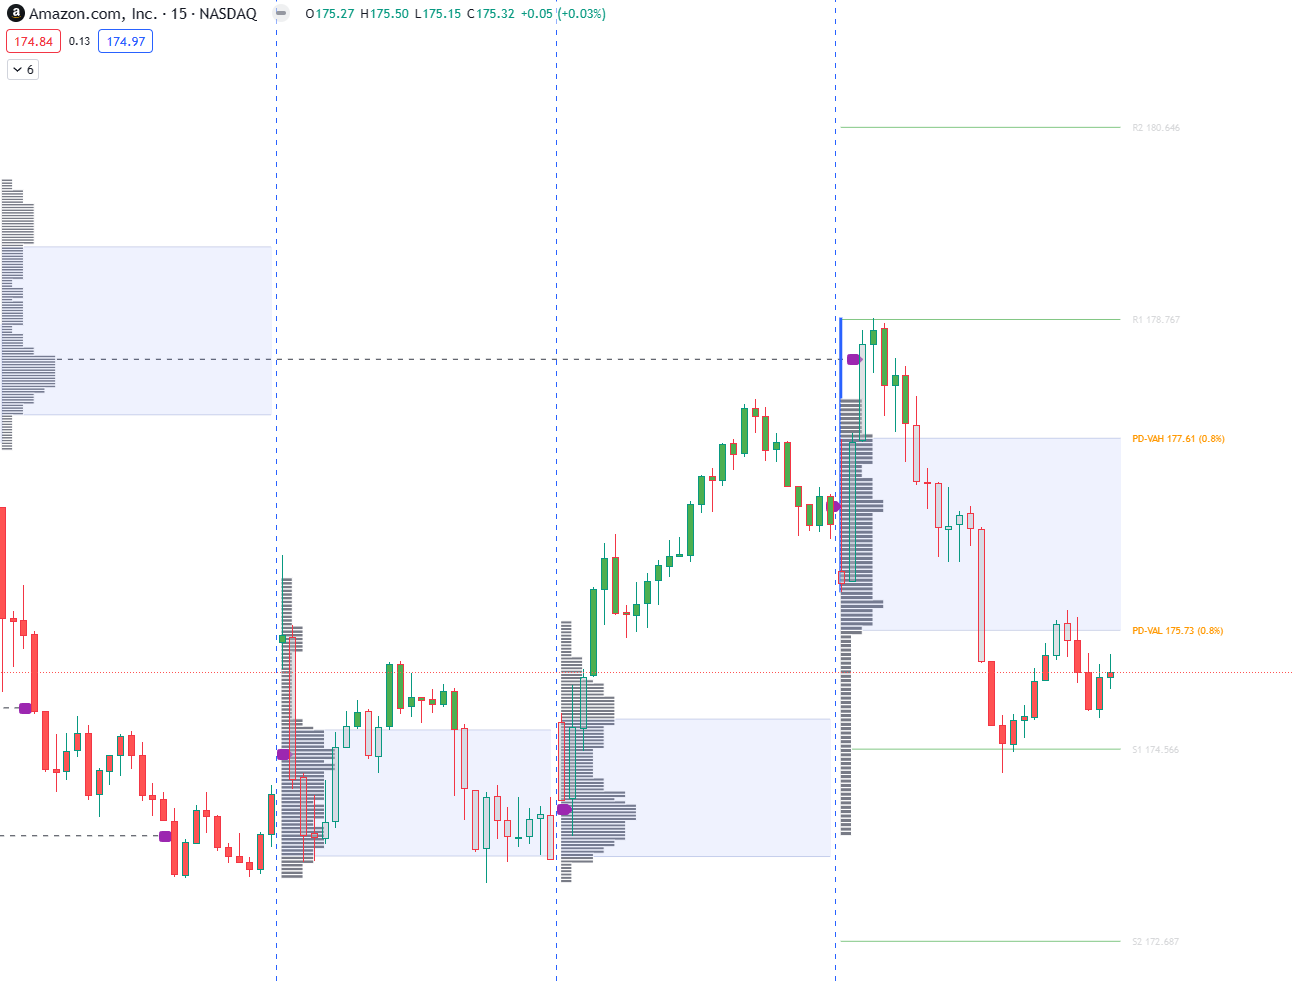
The Tradingview indicator plots the volume traded at each price level over a specified time period. This creates a graphical representation of the volume distribution. The histogram can be used to identify high volume and low volume nodes.
Value Area
The indicator highlights a value area, which is a range of prices where the majority of trading activity occurred. Traders may use this area to gauge the fair value of an asset or to identify potential trading opportunities
Untested VPOCs
Untested Volume Point of Control represent price levels at which the highest volume of trading activity occurred prior. They are significant since that is where the market participants perceived the fairest value for the asset
ValueAreas Stats Table
Realtime chart statistics
The indicator plots a table that provides a comprehensive view of the value area, initial balance, and volume profile statistics for the Intraday time frame.
- Price Relative To Value Area.
- Quickly identify if the current price is above, below, or inside the value area. This can help you identify potential trading opportunities and gauge the fair value of an asset.
- Price Relative to Initial Balance.
- Find out if the current price broke out of the configurable initial balance range or is trading sideways inside the initial balance.
- Fibonacci Price Targets.
- The indicator plots upto 3 Fibonacci retracement levels based on the value area. Quickly see how far the price has moved outside of Value.

Automatic Candlestick Coloring
Faster Clarity on Market Structure
The indicator automatically colors the Candlestick bars based on the value area. This allows you to quickly identify the market structure and potential trading opportunities.
- Green Bars
- The indicator plots green bars when the price is trading above the value area. This can help you identify potential long trading opportunities.
- Gray Bars
- The indicator plots gray bars when the price is trading inside the value area. This can help you identify potential sideways markets. The idea is to watch the market as it finds balance.
- Red Bars
- The indicator plots red bars when the price is trading below the value area. This can help you identify potential short trading opportunities.

Value Area Alerts
Realtime Alerts based on valuearea
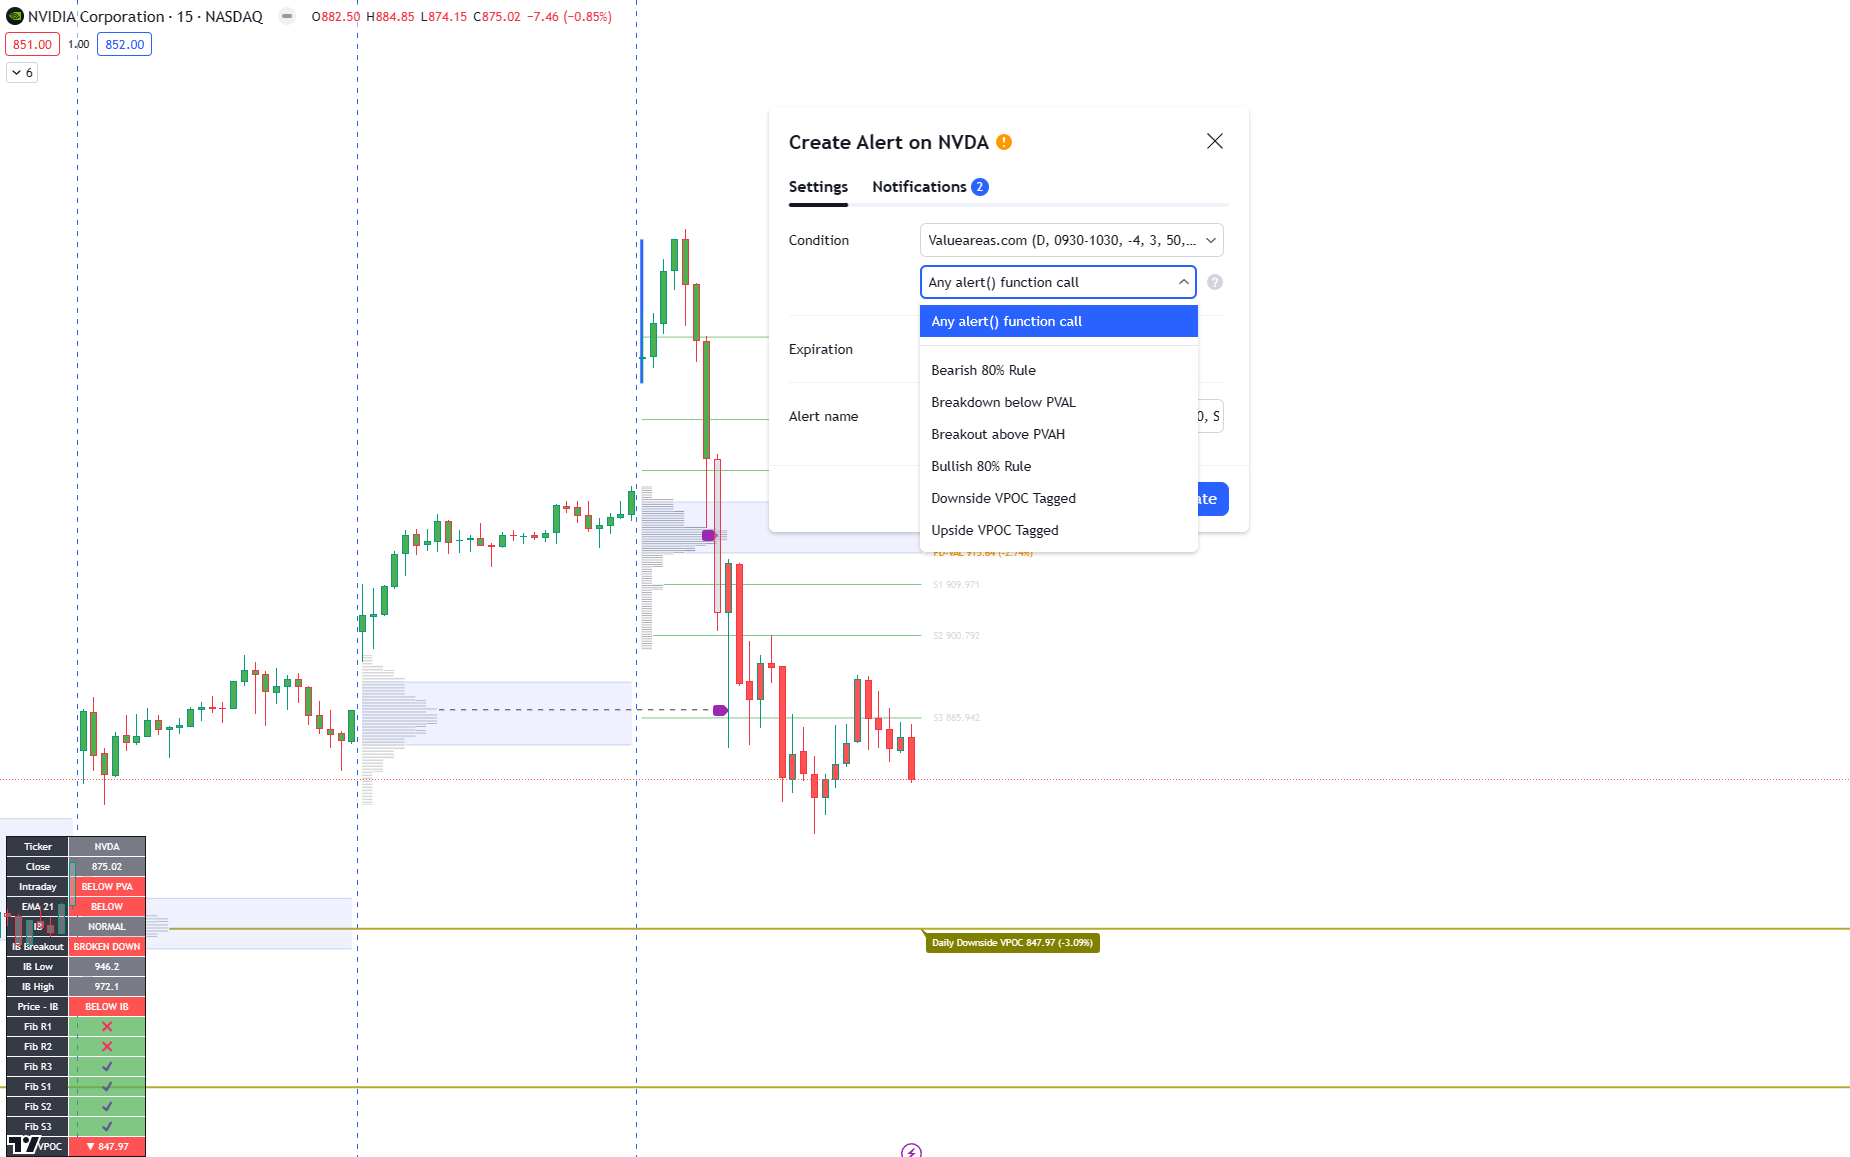
Configure alerts based on the value area and volume profile concepts. Get notified when the price breaches the value area or tags high probability VPOCs.
- Price breaks out of Value Area.
- Get alerted when the price breaks out of the value area. This can help you identify potential trading opportunities as the market moves from balance to imbalance.
- Price tags a High Probability VPOC.
- VPOCs are price magnets and indicate high volume areas. Get alerted when the price tags a high probability VPOC. This can help you identify potential entry and exit levels.
- Bullish/Bearish 80% rule.
- The 80% rule is a market profile concept that states that price will traverse the entire value area 80% of the time in search of liquidity. This can help you identify potential reversals or continuation patterns.
